How SQL Queries Are Processed?
Every query takes the same fundamental path through PostgreSQL:
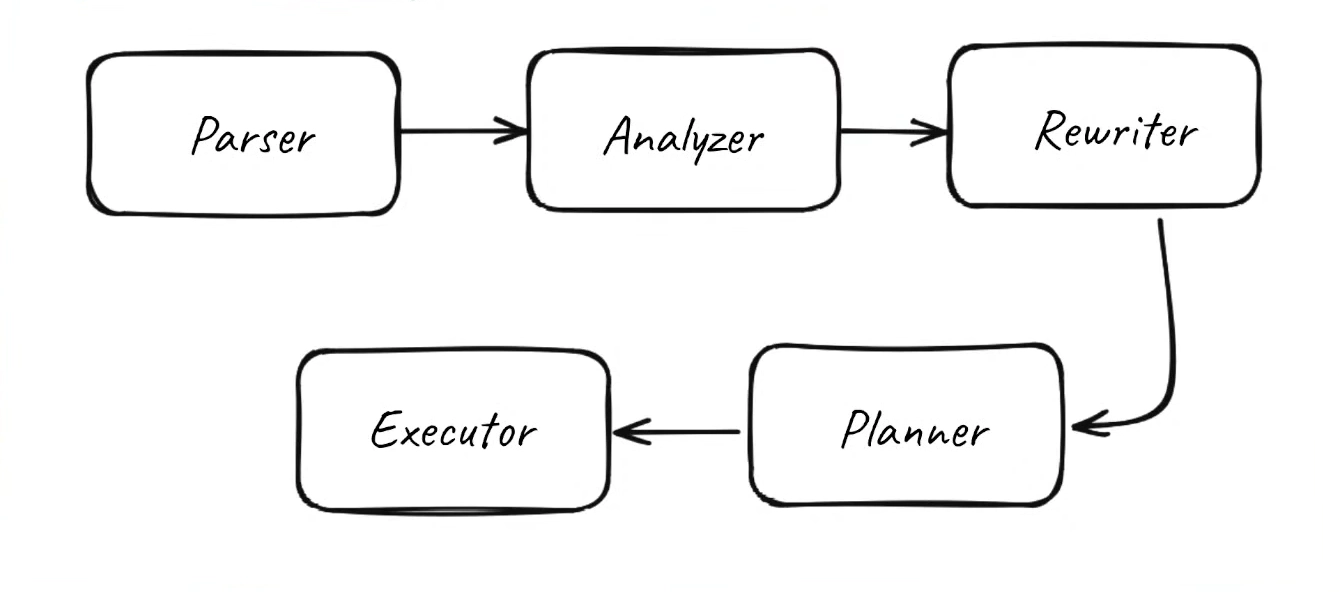
Stage 1: Parsing - 'Is this even valid SQL?'
The parser identifies names, verbs, and clauses, but it doesn’t yet understand what they mean in the context of your database. (Like english teacher!)
We send:
SELECT * FROM users WHERE age > 30;PostgreSQL first checks:
Syntax correct?
Table/keywords valid? etc
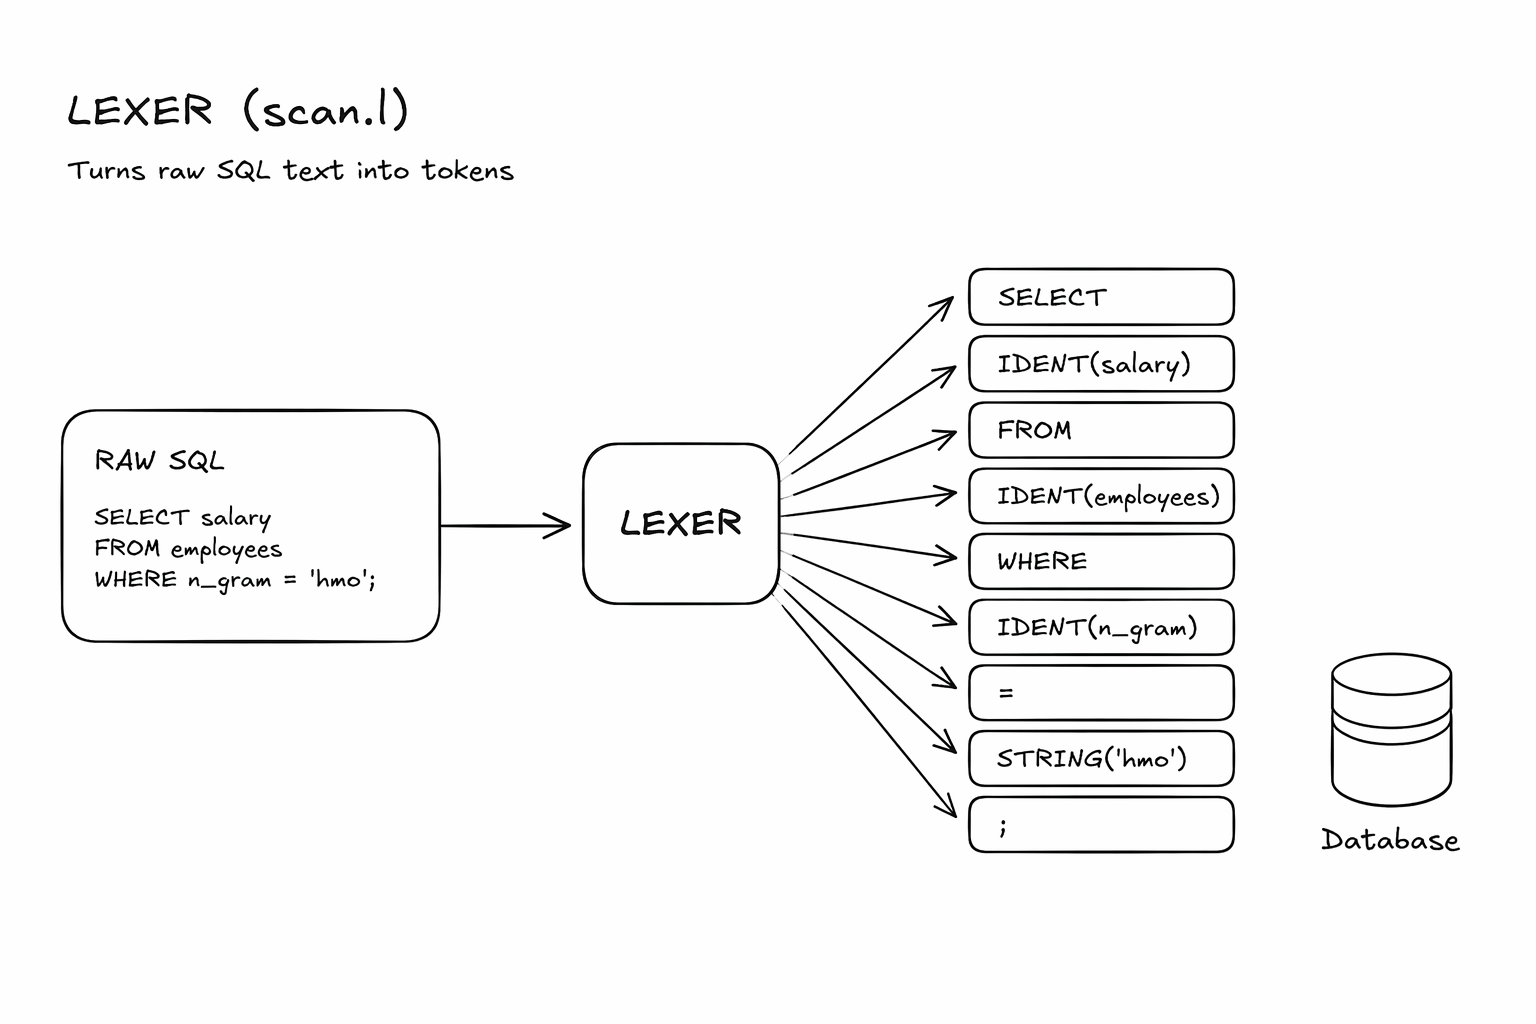
The lexer breaks the raw SQL text into tokens.
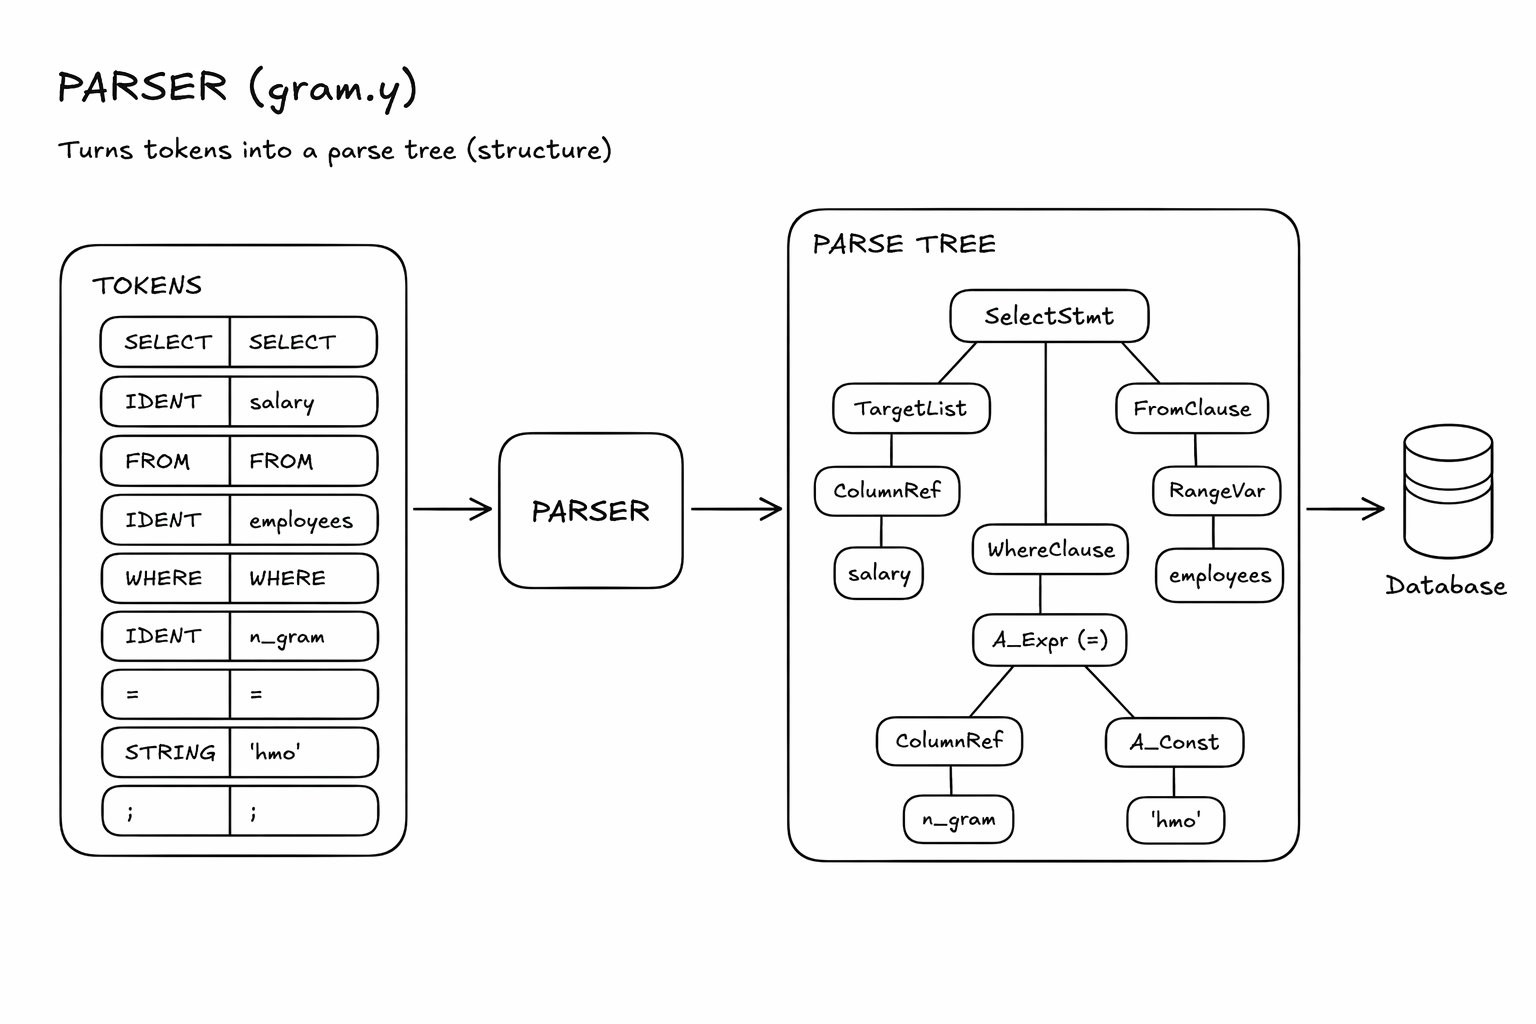
The parser takes those tokens and checks whether they follow SQL grammar rules.
Stage 2: Analysis - 'Wtf mean?'
The analyzer does several critical things:
Resolves references: It looks up employees in the system catalogs to verify the table exists. It checks whether the columns exist in that table.
etc… wait? so parser and analyzer are same? not really.
Parser = "Is this SQL syntactically valid?"
Analyzer = "Do these tables/columns actually exist?"
Now PostgreSQL understands what our query means! yay!
Stage 3: Rewriting - “Can I simplify this(even if no one asked for!)?”
The rewriter takes our semantically valid query tree and applies automatic transformations.
We can use this phase as security validation as well! After applying all transformations, PostgreSQL has the final version of the query. The next step is figuring out the most efficient way to execute it.
It answer: Can this query be transformed into another equivalent query before optimization?
Example: View Expansion
Suppose you have:
CREATE VIEW active_users
AS SELECT id, name
FROM users
WHERE is_active = true;
And you run:
SELECT * FROM active_users;Parse Tree
Initially:
SELECT * FROM active_usersRewriter Output
The rewriter replaces the view with its underlying query:
SELECT id, name
FROM users
WHERE is_active = true;
Basically rewriting the query to its expanded form.
Stage 4: Planning - “What’s the best way to run this?”
(most sophisticated part)
The planner examines all available indexes for each table and evaluates which access method will be fastest. Sometimes an index lookup is the clear winner. Other times, especially for small tables or when you need most of the rows, a sequential scan is actually faster because it avoids the overhead of index navigation.
This is why the planner, which optimizes the parsed query, is one of the most complex elements of the system.
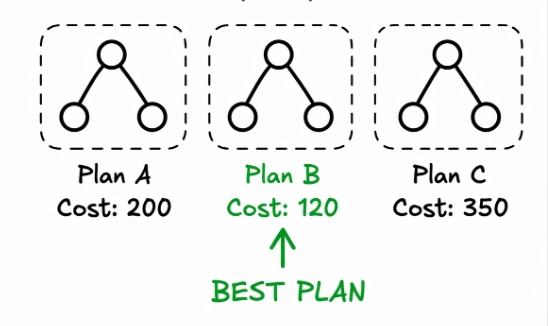
With all this information, the planner evaluates different execution strategies. For each possible plan, PostgreSQL calculates an estimated cost based on:
- Expected disk I/O (reading pages from disk or cache)
- CPU usage (processing rows, evaluating conditions)
- Memory requirements (sorting, hashing)
The planner explores multiple options and picks the one with the lowest estimated cost
But wait have you noticed any problem here?
When your query joins many tables, the number of possible join orders explodes exponentially. ex. for 3 tables how many possibilities?
(PostgreSQL switches to a Genetic Query Optimizer (geqo_threshold) that uses DP and heuristics approach.)
- “Dynamic programming: “Don’t solve the same sub-problem again and again”
- Heuristics: “Don’t try everything: use rules to skip bad options”
(Like the obvious ones)
Wait a minute! Is there any way we can stop here and see what results we got before actually executing?(So we don’t delete prod accidentally?)
yes! we do have! that’s what EXPLAIN do!
Suppose you have:
SELECT *
FROM employees
WHERE department = 'Sales';
If you run:
EXPLAIN
SELECT *
FROM employees
WHERE department = 'Sales';
You might see:
Seq Scan on employees  (cost=0.00..18.10 rows=3 width=64)
  Filter: (department = 'Sales')

  👉 PostgreSQL plans to:

  Scan entire employees table
  Expects ~3 rows
Thinks it’s very cheap (cost 18.10)
Each row ≈ 64 bytesStage 5: Execution -”enough talk! now do the actual work”
“Okay, I know the best way. now let’s actually run it.”
It does NOT rethink
It does NOT optimize anymore
It just follows instructions
PostgreSQL uses a pull-based execution model.
It’s like “Nothing happens until the top node asks for data.”
The top node of the execution plan initiates the process by requesting rows from its child nodes. Each node processes data and passes results up the tree until the final output is produced.
Again wait a minute! Is there anyway to see final stats? yes! we have explain analyze.
EXPLAIN ANALYZE

Seq Scan on users  (cost=0.00..2.00 rows=100 width=11)
(actual time=0.010..0.014 rows=99 loops=1)
Planning Time: 0.049 ms
Execution Time: 0.048 ms

👉 What actually happened:

Full table scan executed
Returned 99 rows (close to estimate ✔)
Took ~0.014 ms to run (very fast)
Planning took ~0.049 ms
Done Execution of your query! hurrah!
Why This Matters?
- Write better queries: Knowing how the planner works helps you structure queries for optimal performance. You’ll understand why certain queries can’t use indexes, why join order matters,etc
- Debug performance issues: When a query is slow, you can use EXPLAIN to see which stage is problematic. Is the planner choosing a bad path? Is an index missing?
- Design better schemas: Understanding how PostgreSQL processes queries informs index design, table partitioning, and view usage.
- Appreciate the complexity: There’s a lot happening behind that simple SELECT statement. PostgreSQL handles connection management, memory allocation, syntax validation, semantic analysis, rule application, cost-based optimization, and pull-based execution(all transparently.)
(Articles I love!)
- Andy Pavlo - Carnegie Mellon UniversityYes, PostgreSQL Has Problems. But We’re Sticking With It!
- Amazon Web ServicesHow PostgreSQL processes queries and how to analyze them
- Jesús EspinoOverview | Internals for Interns
- Crunchy DataWhen Does ALTER TABLE Require a Rewrite? | Crunchy Data Blog

Thank you for reading! See you in the next one!